Non-manufacturing ISM fell to 53.9 (consensus 53.5) in December from54.1 in November. Though the decline was less than expected, it stillbrings the index to its lowest level in 9 months. Following theweakness in employment this morning, and continuing erosion of themanufacturing and housing sectors, any indication of weakness in theservice sector will be viewed ominously by the markets, as a furtherindication of recessionary tendencies in the economy. Services nowmake up 87% of the total US economy. As long as the reading staysabove 50, it indicates continued expansion.
The notable weakness in today's report was for new export orders,which declined to 50 from 55.5 the prior month. Many other categoriesactually showed improvement. New orders rose to 53.5 from 51.1, orderbacklogs rose slightly but remains negative at 49, employment rose to52.1, and prices paid eased back to 72.7 from 76.5.
Industries experiencing growth in December include retail trade,information, professional and scientific, construction, and healthcare.
Weakness was observed in management support services, other services,food and hotel, real estate, leasing, finance and insurance, wholesaletrade, education, and entertainment.
Friday, January 4, 2008
Labor Market Weakens Dramatically in December
The economy only created 18k new jobs in December (consensus 70k), andthe unemployment rate surged higher to 5% (4.8% consensus). Both aremuch worse than expected. The last time this few jobs were created ina month was back in 2002, and the last time the unemployment rate wasthis high was in 2004. Net revisions for the two previous monthsadded 10k new jobs.
The Fed has indicated in the past that the economy needs to createbetween 125-150k in new jobs per month to keep up with the labor forcegrowth. Earlier in the year, the economy was achieving this goal, butover the past 6 months average monthly new job growth has fallen to87k. Total new jobs created in 2007 were 1.33 million, the lowestannual growth rate in 4 years.
Typically, when the unemployment rate rises by .3, it is viewed as arecessionary indicator. It did that in only one month in December.The unemployment rate has now risen .6% since it hit a low of 4.4%last spring. The household survey showed a decline of 436k inemployment in December, and an increase of 516k in the pool ofavailable labor. The household survey has been very volatile inrecent months, so there is a good chance that the unemployment ratemay decrease next month. The participation rate fell to 665 from66.1%.
The weakness in growth was focused on the private sector, as thegovernment added a better than trend 31k in new jobs in December.Areas showing the most weakness include goods-producing (-75k),construction (-49k), manufacturing (-31k), trade and transport (-28k),and retail trade (-24k). The pace of decline in shedding jobs in themanufacturing and construction industries accelerated in Decemberwhich is not surprising based on the housing and ISM data. Growthremains in the services area, with 93k new jobs added by banks andrestaurants, down from +160k in November. Business services grew by43k, and education/health added 44k new positions.
The workweek held steady at 33.8 hours, though the manufacturingworkweek eased back to 41.1 hours, the shortest in at least sixmonths, and a decline of -.5% from the prior month. Manufacturingovertime slipped by 2/10ths of an hour as well, to 3.9 hours a week.Manufacturing aggregate hours plunged by -.7% MoM, implying furtherweakness in factory output.
Hourly earnings growth fell to the lowest pace in the past year and ahalf at 3.7% YoY. Average weekly earnings also fell from 3.8% annualgrowth in November to 3.4% YoY in December. Slower job growth, andslowing wages, suggest personal spending growth will slow. This is aconcern in an economy so dependent on the consumer for growth.
Though the increase in the unemployment rate in December is huge, anda clear sign of recessionary risks, the overall unemployment rate isstill low at 5%. The slowdown in job creation was broad based inDecember, and certainly suggests the demand for labor is weakening.This data supports the market's expectation of another rate cut by theFed at the end of January. Most are now questioning whether it willbe a 25 or 50bp cut.
Thursday, January 3, 2008
Labor Market Weakening
Initial jobless claims for two weeks ago were revised higher to a newtwo year high of 357k, but fell 21k last week to a lower level thananticipated of 336k (consensus 345k). Continuing claims continue torise, increasing to the highest level since the autumn of 2005, at2.76 million (+46k week over week). The unemployment rate for workerseligible for unemployment benefits rose from 2 to 2.1%. The claimsdata is pointing to a slowing job market as the economy cools.
The ADP estimate for job growth in December rose 40k, excludinggovernment workers. This was slightly better than the 33k consensusestimate. Non-farm payroll growth for tomorrow is estimated to show70k net new jobs created in December. The unemployment rate isexpected to tick up to 4.8% from 4.7%.
Earlier this morning, the Challenger report showed job cuts falling-19% YoY in 2007, and layoffs falling -8.5% YoY, indicating companieshave held on to skilled workers as the economy slows. 2007 saw thenumber of total job cuts fall to the lowest level since 2000, butfinancial firms tripled job cuts to 150k in 2007, versus only 50k in2006, as the mortgage market fallout impacted bank and investmentfirms adversely.
November Factory Orders unexpectedly Surge Due to Higher Oil Pricesand Aircraft Orders
Factory orders rose +1.5% MoM (consensus +.5), much more thanexpected, and the largest monthly increase in four months. The gainwas primarily due to higher oil prices pushing up the value of refinedgoods. Demand for refined petroleum rose 16%, and pushed demand fornon-durable goods up 3% MoM, the largest increase in non-durable goodsin 2.5 years. Higher prices for agricultural products and metals alsoraised the value of non-durable goods orders. Demand for machineryactually fell, indicating slipping demand for durable goods andcapital investment. Durable good demand, which account for just over50% of total factory orders, fell -.1% MoM. This is an improvementfrom the -.5% MoM decline in durable goods order the prior month.Aircraft orders rose 21% MoM, pushing up transportation orders by+1.5% MoM. Excluding transportation, new factory orders rose +1.4%MoM in November. Excluding defense, factory goods orders rose +1.2%MoM. Unfilled orders rose +1% MoM, and have grown by 16.9% YoY.
Orders for non-defense capital goods excluding aircraft are used as anindicator for future business spending. This figure fell -.1% MoM inNovember, also an improvement from the 3% MoM decline in October.Shipment for this category rose +.2% MoM in November after falling-1.2% MoM the prior month. Non-defense capital goods excludingaircraft unfilled orders are up +9.5% YoY, while shipments have risen+1.5% YoY.
The outlook though is not good, as banks rein in credit, andmanufacturing ISM saw the largest monthly drop in five years duringDecember. Inventories also jumped +.8% MoM in November, the largestincrease in a year and a half, but the inventory to sales ratio easedto 1.22 months from 1.23 months in October. Inventory growth, whichhas grown +2.9% YoY, reduces future demand.
Over the past year, new factory orders have grown by +5.3% YoY, withex-transportation growing +7.5% YoY and ex-defense growing +6.8% YoY.Capital goods orders have declined by -1.4% YoY, while durable goodsorders have eased by a more moderate -.5% YoY. Transportationorders have fallen -5.7% YoY and computer orders have fallen -5.2%YoY.
Today's Tidbits
15% Home Price Drop Over Next 5 Years Required to Restore Historic Rent Ratio
From The Wall Street Journal: “U.S. house prices "likely would have to fall considerably" to return to a normal relationship with rents, says a study by one former and two current Federal Reserve economists. The study, which doesn't necessarily reflect the views of Fed policy makers, suggests prices would have to fall 15% over five years, assuming rents rose 4% a year. House prices would have to fall further if the adjustment took place more quickly. The study tracks rents and home prices back to 1960 and found annual rents fluctuated at around 5% to 5.25% of home prices until 1995. At the end of that year, the average monthly rent was about $553 (or about $6,600 a year) and the average home price was about $134,000. But starting in 1996, home prices started to grow much more rapidly than rents. By the end of 2006, they had more than doubled to an average of $282,000, while the average rent had risen 48% to $818. That drove the annual rent/price ratio down to 3.48%. That means the rent/price ratio is about a third below its long-term average. To return to normal would require some combination of falling prices and rising rents. The paper suggests house prices would need to fall about 3% a year, if rents grew in line with their 4% average annual growth this decade. Of course, the link between house prices and rents can remain out of whack for years… lower long-term interest rates can explain only a small part of the drop in the ratio. "To justify current price levels, you need rapid growth in rents." But it's hard to imagine the scenario that would justify such rapid growth in rents, he added. Indeed, it's possible rents will grow more slowly than 4%, reflecting the overhang of unsold homes that might be rented out… the authors postulated a five-year horizon for the rent/price ratio to return to normal by looking at previous downturns. "When a downturn begins, it will last for a while."”
Alt-A Market Had a Bad Year in 2007
From Merrill Lynch: “Not only has the subprime mortgage market that fuelled the last leg of the bull run in housing in 2005-06 been completely shut down, but look at what has happened to the Alt-A market: Volume lending in this space plunged by 64% in 3Q to $39.3 bln from the 2Q record high of $109.5 bln just before the credit crunch intensified …The delinquency rate here may not be the near-20% it is in subprime, but for the 2006 vintage is up to 4.71% from comparable loans made in 2005 (1.97%) and those in 2004 (1.07%) – making this the worst year for Alt-A credit quality on record.”
Delinquent Consumer Loan Payments Rise to Highest Level Since Last Recession
From Reuters: “Americans are falling further behind on consumer loans, with late payments rising to the highest level since the nation's last recession in 2001, data released Thursday show. In its quarterly study of consumer borrowing, the American Bankers Association said the percentage of loans at least 30 days past due rose to 2.44 percent in the July-to-September period from 2.27 percent in the previous quarter. The delinquency rate, which covers eight loan categories, was the highest since a 2.51 percent rate in the second quarter of 2001. Late payments on some types of loans rose to levels not seen since the 1990s… In the July-to-September period, the delinquency rate on home equity loans rose to a two-year high of 2.28 percent from 1.99 percent in the prior quarter, the ABA said. The rate of late payments on home equity lines of credit rose to 0.84 percent, the highest since the fourth quarter of 1997. Meanwhile, late payments on "indirect" auto loans, which are made through dealerships, totaled 2.86 percent in the third quarter, a 16-year high. Credit-card delinquencies fell to 4.18 percent from 4.39 percent in the second quarter.”
From Dow Jones: “Consumer bankruptcy filings climbed 40% in 2007, as the ongoing turmoil in the housing market and growing debt levels held by consumers led more individuals to seek protection from creditors. The American Bankruptcy Institute, using data from the National Bankruptcy Research Center, said that total consumer filings were 801,840 for 2007… The large annual increase came despite a decline in consumers filing for bankruptcy protection between December and November. There were 66,389 consumer filings in the last month of the year, compared to 71,799 filings in November.”
More Companies Expecting a Recession
From The Financial Times: “America has entered 2008 in greater danger of recession than at any stage since the collapse of the internet bubble in 2000-01, as the world’s largest economy struggles to maintain growth in the face of the credit squeeze, a housing slide and high oil prices. Fourth-quarter growth for 2007 looks likely to come in at 1 per cent or less on an annual basis, while the current three months are unlikely to be much better and could even be worse… According to the latest NBC News/Wall Street Journal poll, more than two-thirds of Americans believe the US is either in recession now or will be in 2008. Some of the country’s most famous economists – including Alan Greenspan, the former Federal Reserve chairman, as well as Lawrence Summers, former Treasury secretary, and Martin Feldstein, president of the National Bureau of Economic Research – put the odds of recession at close to 50-50. This is striking, because economists say it is almost impossible to forecast recessions and, in the last quarter of a century, there have been only two brief and shallow periods of negative US growth...Bill Gross, chief executive of Pimco, the world’s largest bond fund manager, goes as far as to say he – like many ordinary Americans – thinks a recession has already started, in December. Ominously, the credit markets have started to price for recession, with risk spreads rising on securities that have no direct connection with the troubled housing or financial sectors…In addition, while credit markets appear to be pricing in an increasingly high likelihood of recession, equity markets and the oil market – while off their highs – are not. Wall Street is divided: Morgan Stanley is forecasting a recession, joining Merrill Lynch and Goldman Sachs, which are long-time bears, but JPMorgan and Lehman Brothers are noticeably less gloomy. Business leaders are split, too, with finance and housing executives much more pessimistic than their counterparts in other sectors… At the heart of the problems is the bursting of the housing bubble that helped to power American growth since this economic cycle started six years ago. The end of the bubble has brought a brutal slide in home construction, house price falls that threaten to undermine household wealth and consumer spending, and turmoil in the credit markets that are used to finance housing. The US has endured financial crises before with little or no effect on the real economy – for example, in 1987 and 1998. But these were autonomous financial crises with little connection to the underlying US economy. This financial crisis is different. It is defined by the bursting of twin bubbles in housing and the credit markets – bubbles that were deeply interconnected. Easy money and the collapse of discipline in the credit markets helped push house prices to unsustainable levels. But when the residential property bubble finally burst it took the credit market bubble with it – decimating the value of hundreds of billions of dollars of securities linked to subprime loans that were safe only as long as house prices kept going up. Now the credit crisis poses a direct threat of its own to the US economy. The secondary market for mortgage securities is dysfunctional, throttling the supply of many types of home finance and thereby putting further downward pressure on the housing market. Meanwhile, banks are being forced to take tens of billions of dollars in housing-related assets, once held in off-balance sheet vehicles, on to their books, while incurring massive writedowns on these and other securities.”
From The New York Times: “…while investors usually cheer an impending rate cut, the minutes only fueled anxiety that the economy would fall into a recession in the coming months.”
From Deutsche Bank: “I do not remember trading a mkt before that was so convinced of a recession even though there is virtually no evidence to support the idea. Undoubtedly, the economy is slowing, led by a moderation in consumer spending. Still, slowing is one thing, a recession is a whole different ball game. The only way Fed Funds go to the 2.5% rate that 2's currently imply is if the economy contracts. As rich as 2's are, 10yr notes are probably worse. The growth and inflation expectations implied by 10's are just plain silly. Yet, the mkt trades very well. Clearly, the set-up trade on the street the last few days of '07 was to get short. Now that 2's are 50bps richer than their auction stop, I'd imagine a lot of the shorts have been cleared out before tomorrow's number. Our economists think that a few more modest Fed eases could lead to a rebound. The street almost always underestimates the resiliency of the US economy. Does it really sound so IMPOSSIBLE that we rebound out of the housing slump? 2.8% 2yrs suggests the mkt thinks so.”
Dealer Outlooks for Economy
From JP Morgan: “For more than a year, a consistent rain cloud has hovered on the horizon as a downturn in housing, financial market stress, and rising energy prices has threatened to derail the US economic expansion. In the event, the economy chugged along solidly through 2007 even as it absorbed these significant drags. GDP growth is tracking 2.8% for the year as a whole (Q4/Q4). Payrolls have averaged a respectable 108,000 monthly gain through the first eleven months of the year and were accompanied by personal income growth of close to 6% …Our inclination is to raise 4Q07 GDP growth (currently 1.5%), while lowering growth for 1H08 (currently 1.75%). Stubbornly high energy prices and a view that some of the strength in 4Q07 demand — notably defense spending and early holiday shopping sales — is set to borrow from growth at the start of this year, warrant this revision.”
From Morgan Stanley: “The benign environment over the past few years of strong synchronous global growth, low inflation, low interest rates, and ample access to liquidity seems to be a relic of the past. The future is clouded with little consensus about how the turn in the credit cycle will play out… 2008 opens with volatility near multi-year highs across financial markets. This backdrop of instability is likely to persist, especially as expectations on central bank policy are far more diverse than this time last year…In our view, this suggests more, not less, volatility across markets going forward… After the strongest four year run in global growth seen in decades, the engine looks set to slow. While the global economy proved resilient to the initial deceleration in the US economy, our economics team looks for housing-related weakness to drag more meaningfully on the consumer. This should result in more spillover to the global economy given the broader reach of the US consumer relative to the insulated US housing market. Indeed, slower growth is already evident in Canada, the UK and, increasingly the Eurozone. China too may slow in the second half of 2008 if policymakers’ attempts at cooling the economy take hold, particularly as Olympics-related spending tapers off. The relatively slower pace of global growth in 2008 would suggest greater downside risks for commodities, weighing on currencies with greater leverage to the global growth cycle… Though it is not clear the worst is yet over for the USD, there is already a lot of bad news in the price… We kick off 2008 …stuck in risk aversion mode. With market sentiment on tenterhooks and the healing process likely to drag on, the safe haven bid should remain alive.”
From Goldman Sachs: “ISM shift to contractionary territory hurts equities, rallies bonds. Oil close to $100/bbl adds to market jitters. Market has priced significant US weakness in rates, consumer stocks. But history suggests recessions see even more easing than now priced. Current expected easing cycle would be unusual as an actual outcome… …since market is pricing more than a mid-cycle episode, less than recession. We see more growth risk than the market still.”
Benefiting From the Return of Stagflation
From Barclays: “The first trading day of 2008 was marked by a blunt reaffirmation of the stagflation theme. Gold, platinum, gasoline, the CRB and crude oil all moved up sharply to new historical highs. Meanwhile, manufacturing data in the UK and the US were weak and below expectations, with Q4 Singaporean GDP surprising by a 3.2% contraction. Although Libor rates have fallen slightly, there is little evidence from either the credit or money markets that the credit crunch is easing in the new year. Indeed, the BoE bank lending survey – the latest of such surveys to be published, conducted between 19 November and 12 December – showed a pronounced tightening in credit terms and availability to both households and companies. Expectations for a quick improvement in the lending markets are wide of the mark. The core problem has been a very rapid growth in bank assets…The annual increase through to November is almost double the average increase of the prior couple of years. Since the annual increase in deposits for US and eurozone banks during 2007 was in line with past experience, the shortage of term funding or liquidity is readily explained. Although the consensus has it that the lack of term liquidity in the money markets is due to mutual fear within the banking system, the truer explanation is simple indigestion, due to involuntary bank asset growth. The process of securing the appropriate funding – presumably via “sticky” retail deposits – for these assets is likely to take some time. It is implausible to believe that the advent of a fresh year will suddenly provoke an outbreak of normality in the money markets. Overall, the economic background of a sharp credit tightening, slowing growth and rising inflation pressures remains very much extant as we enter 2008… we should expect to see Asian and Western economy growth rates diverge. The economic implications of this situation are wholly and perhaps counter-intuitively negative. The continuation of strong Asian and developing economy growth is one of the factors pushing natural resource prices higher. In turn, the effect of higher commodity prices on US and European inflation rates is to curtail central banks’ freedom of manoeuvre, limiting the degree to which they can offset the credit crunch with lower rates… Stagflation is not a positive environment for equities. As we have pointed out in the past, history shows that equities deliver their worst returns (an average annual total return of minus 1.9% in real terms or 4% in nominal terms since 1929) during economic interludes characterised by above-trend inflation and below-trend growth. Fairly obviously, the underlying cause of this weak performance is likely to be a latent fear that high inflation will inhibit monetary authorities from fully offsetting the contraction with lower interest rates, compounding the more typical concern that slower growth will bring lower profits… In the current instance, the stagflationary condition could prove more persistent than usual. For the sake of example, although US growth has decelerated very sharply, there is no evidence of a comparable deceleration in commodity demand. Indeed, even within the US, gasoline demand in December is set to record the 26th straight month of year-on-year increases, according to our commodity colleagues. Meanwhile, non-OECD oil demand growth remains robust, with non-OPEC supply continuing to surprise the market to the downside. At the risk of gross over-generalisation, the primary causes of the supply/demand imbalance in the physical resource markets are twofold. First, there has been a very significant increase in the level of demand driven by rising per capita demand in the large developing economies. Second, a combination of diminishing easily accessible supplies, a rampant inflation of sectoral labour and capital goods costs and the various influences of global warming have all conspired to dampen supply growth across a wide range of raw materials. Both of these factors are more secular than cyclical in nature and are not likely to be repealed by slower growth. A further consideration regarding the persistence of stagflation is the desychronisation of regional growth patterns, with growth in the emerging economies – who have been responsible for the bulk of the resource demand increase – remaining firm for the time being. If equity exposure should be eschewed in a stagflationary phase, the historical record is more confusing for bonds. For an entire 77-year sample of US asset returns, we have found that bond (20-year average maturity) returns are typically very weak, averaging just 1% in nominal terms during stagflationary periods. However, if we confine the sample to the past 20 years, we find that average nominal bond returns are a more respectable 6.4%. Although the latter sample is of necessity very small, these findings would seem to suggest that the bond market’s response pattern to stagflation may have undergone a shift during the 1980s. This shift was perhaps engendered by increased confidence that intervals of high inflation would always prove transitory, inflation eventually responding to slower growth under the standard output gap analytical framework… Overall, we continue to feel that the current stagflationary environment justifies the negative view we have taken on equities and the cautiously bullish views we have taken in bonds of both the real and nominal varieties, along with commodities.”
Asset-Backed Commercial Paper Market Shows Signs of Improving in New Year
From Bank of America: “Asset-backed commercial paper outstanding rose last week for the first time since mid-August.”
From Citi: “Yesterday saw a sharp move down in the asset-backed CP spread (167bp from 283bp) which suggests that a significant part of the recent rise was related to year-end funding concerns and was not of a more structural nature.”
From Barclays: “Yields on 30-day ABCP have fallen close to 40bp over the week and the spread over fed funds has come down considerably (to 50bp) after widening close to 200bp in mid-December. The asset-backed CP market had been deteriorating on continued tensions in money markets spurred by concerns abut year-end funding and mortgage-related collateral, which backs a notable portion of ABCP. Today's data hints at some improvement in this area of the market now that year-end funding pressures have faded, but we would have to see the improvement be sustained in coming weeks to draw any firm conclusions.”
Another Bull Year for Commodities?
From Citi: “What happened in commodities yesterday has happened before. In both 2004 and 2005, the GSCI rose sharply at the very start of the new year…In 2004, it rose 3.7% on the second trade date of the year and in 2005 it rose 1.5% on the second trade date of the year. In both cases it turned out to be an absolutely phenomenal year for commodities as the GSCI index was up over 42% to the high in 2004 and over 56% to the high in 2005. Both years saw peaks in late summer and, here is the important part, both rallies were due to massive asset in-flows into commodity space. We rose over 3% yesterday and my opinion is that we are again seeing massive asset flows into commodity space. Implications if I'm right: 1) Hard not to be a rip snorting bull in commodities as a little bit of money can go a long way in that space 2) We would see $4 gasoline at the pump and that would not be good for the U.S. economy. 3) Can $1000 gold and a 3 handle on 10's co-exist? I don't think so, for long. 4) Not necessarily bearish for dollar or stocks. 2004 saw dollar rise and energy and materials are 15% of S&P compared to 18% for financials.”
From Merrill Lynch: “…the Baltic Dry Index (measures global shipping rates) has slid sharply and at 8,891 today it is almost 20% below the mid-November peak and down to a four-month low.”
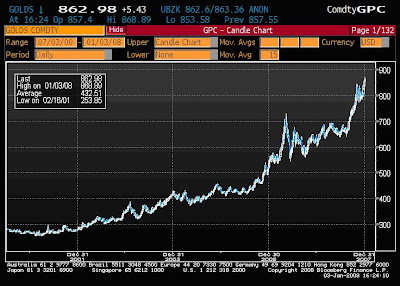
From Barclays: “…we wanted to highlight the strength of the ongoing upside trend in gold. The yellow metal is rallying against the major currencies and has been outperforming the Dow Jones Industrial Average since 2000. We are looking for the market to test 1000 in 2008. Over the last few years, gold has rallied 32% and 24%, respectively. The average annual gain over the past seven years has been approximately +16%. Since the market is currently approximately 16% below 1000, our 2008 target actually implies an average year of gains for Gold.”
Questioning Value of Credit Rating Agencies
From The Street.com: “Here's a New Year's resolution for Wall Street: Stop letting credit ratings agencies get paid by debt issuers for grades that can make or break their products. In the mortgage debacle that plunged U.S. financial markets into crisis last year, there's no shortage of culprits. Snake oil-selling lenders, naive borrowers, delusional investment bankers and snoozing regulators all fit the bill, but the major credit rating agencies stand out as the chief enablers. Blessed by government regulators with their unique and exclusive authority, the ratings firms institutionalized the notion that securities backed by subprime loans were basically risk-free. In other words, rather than fulfilling their proper role in the market by warning investors about the obvious risks involved in these securities, they instead opened the floodgates to all those bad actors and created a systemic problem. Why did the credit rating agencies fail so spectacularly? There's one simple reason: They were paid handsomely for their stamp of approval by the very financiers who were packaging up the bad loans and selling them around the world. "It's as if movie studios hired film critics to review their movies, and paid them only if the reviews were positive enough to get lots of people to see a movie," former Labor Secretary Robert Reich wrote on his blog. "The whole thing rested on a conflict of interest analogous to that of stock analysts who, before the dotcom bubble burst, advised clients to buy stocks their own investment banks were issuing."
MISC
From Merrill Lynch: “…the ADP data has had this tendency to overestimate private payrolls over the past 3 and 6 months. This is because the ADP does not include many large financial institutions, which do their own payroll and this sector right now is at the epicenter of the job cuts (along with housing).”
From Bank of America: “Our outlook for 2008 for credit finds the solution to the subprime mortgage crisis in a classic recipe: inflate your way out of it. Either by accident or intention, global central bank liquidity infusion to forestall the slowing impact from the credit crunch likely results in increased inflation.”
From CITI: “The aggressive liquidity injections from central banks have been part of a strategy to expand their own balance sheets in order to facilitate an orderly contraction of private sector balance sheets. It is still relatively early in the adjustment process and the central banks are likely to have to continue providing liquidity for at least the next quarter while withdrawing it at a gradual pace. Looking ahead to the rest of 2008, it is possible that greater regulation of financial market participants could be one of the direct outcomes of the credit crunch.”
From Dow Jones: “Bond guru Bill Gross, the founder and chief investment officer of PIMCO, said he expects the U.S. Federal Reserve to keep cutting rates in 2008, “perhaps as low as 3% and maybe more depending on the housing situation.” The Fed’s current current fed funds rate target is 4.25%. Gross, in an interview with CNBC, said inflation concerns and the weak dollar are “third and fourth order” considerations for the Fed, and it will focus on a “substantially” slowing U.S. economy for monetary policy. Gross told CNBC that the U.S. credit contraction problems will continue as part of a two-to-three-year housing cycle.”
From The Associated Press: “In a sign of how the once mighty U.S. dollar has fallen, India's tourism minister said Thursday that U.S. dollars will no longer be accepted at the country's heritage tourist sites, like the famed Taj Mahal.”
From Bloomberg: “Foreign investors exploited the declining U.S. dollar during the past three months to snap up American companies, taking the biggest share of U.S. deals in at least a decade. Buyers from Dubai to the Netherlands accounted for 46 percent of the $230.5 billion of U.S. mergers and acquisitions announced in the fourth quarter, the largest portion since 1998 when Bloomberg started compiling the data. The total excludes $17.9 billion of so-called passive investments by state-run funds in Asia and the Middle East in U.S. banks, including New York-based Citigroup Inc. The influx of overseas buyers cushioned a drop in domestic deals, as tighter credit markets ended the leveraged buyout boom that spurred record-setting takeovers in the first half 2007. Foreign acquirers, who stepped in as the dollar fell 10 percent against the euro last year, show no sign of losing interest, according to bankers and lawyers.”
From Dow Jones: “The yen is on a tear versus its currency rivals in the first days of 2008… It hit a five-week high against the dollar this week…[But] The simple argument against the yen this year is the same one that was used last year, the year before that and the one before that: interest rate differentials. The Bank of Japan’s key interest rate stands at a tiny 0.50%, while the central banks in the U.S., the U.K. and the euro zone have lending rates that range between 4% and 5.5%. Investors who buy the yen and sit on it are earning significantly less interest than they would with currencies from those other regions. With such small returns offered on the yen, Reid believes that investors will continue to use Japan’s currency as a funding currency for the carry trade, in which they take out loans denominated in yen to buy higher-yielding currencies.”
From Merrill Lynch: “We have motor vehicle sales tracking near 16.2 mln units, above street expectations of 16.0 mln units.”
From SunTrust: “Since Christmas, the 2 yr note has fallen 51 bp. The 2/10 spread is +107 bp, the widest in 3 years. The Treasury market is heading into the December payroll report very near recent highs and almost exactly at identical levels just prior to the last jobs number.”
End-of-Day Market Update
From RBSGC: “The main 'play' on Thursday was the steeper curve with 2s improving on the day while the balance of the curve merely tread water.”
Three month T-Bill yield fell 2 bp to 3.23%.
Two year T-Note yield fell 6.5 bp to 2.81% ( A new 3yr low)
Ten year T-Note yield fell 1 bp to 3.90% (3y low is 3.84%)
Dow rose 13 to 13,057
S&P 500 unch at 1447
Dollar index fell .1 to 75.87
Yen at 109.3 yen per dollar
Euro at 1.475 dollars per euro
Gold rose $5.6 to $863 – A new record high of $869 traded today!
Oil fell .49 to $99.13 – A new record high of $100.09 traded today!
*All prices as of 4:20pm

From The Wall Street Journal: “U.S. house prices "likely would have to fall considerably" to return to a normal relationship with rents, says a study by one former and two current Federal Reserve economists. The study, which doesn't necessarily reflect the views of Fed policy makers, suggests prices would have to fall 15% over five years, assuming rents rose 4% a year. House prices would have to fall further if the adjustment took place more quickly. The study tracks rents and home prices back to 1960 and found annual rents fluctuated at around 5% to 5.25% of home prices until 1995. At the end of that year, the average monthly rent was about $553 (or about $6,600 a year) and the average home price was about $134,000. But starting in 1996, home prices started to grow much more rapidly than rents. By the end of 2006, they had more than doubled to an average of $282,000, while the average rent had risen 48% to $818. That drove the annual rent/price ratio down to 3.48%. That means the rent/price ratio is about a third below its long-term average. To return to normal would require some combination of falling prices and rising rents. The paper suggests house prices would need to fall about 3% a year, if rents grew in line with their 4% average annual growth this decade. Of course, the link between house prices and rents can remain out of whack for years… lower long-term interest rates can explain only a small part of the drop in the ratio. "To justify current price levels, you need rapid growth in rents." But it's hard to imagine the scenario that would justify such rapid growth in rents, he added. Indeed, it's possible rents will grow more slowly than 4%, reflecting the overhang of unsold homes that might be rented out… the authors postulated a five-year horizon for the rent/price ratio to return to normal by looking at previous downturns. "When a downturn begins, it will last for a while."”
Alt-A Market Had a Bad Year in 2007
From Merrill Lynch: “Not only has the subprime mortgage market that fuelled the last leg of the bull run in housing in 2005-06 been completely shut down, but look at what has happened to the Alt-A market: Volume lending in this space plunged by 64% in 3Q to $39.3 bln from the 2Q record high of $109.5 bln just before the credit crunch intensified …The delinquency rate here may not be the near-20% it is in subprime, but for the 2006 vintage is up to 4.71% from comparable loans made in 2005 (1.97%) and those in 2004 (1.07%) – making this the worst year for Alt-A credit quality on record.”
Delinquent Consumer Loan Payments Rise to Highest Level Since Last Recession
From Reuters: “Americans are falling further behind on consumer loans, with late payments rising to the highest level since the nation's last recession in 2001, data released Thursday show. In its quarterly study of consumer borrowing, the American Bankers Association said the percentage of loans at least 30 days past due rose to 2.44 percent in the July-to-September period from 2.27 percent in the previous quarter. The delinquency rate, which covers eight loan categories, was the highest since a 2.51 percent rate in the second quarter of 2001. Late payments on some types of loans rose to levels not seen since the 1990s… In the July-to-September period, the delinquency rate on home equity loans rose to a two-year high of 2.28 percent from 1.99 percent in the prior quarter, the ABA said. The rate of late payments on home equity lines of credit rose to 0.84 percent, the highest since the fourth quarter of 1997. Meanwhile, late payments on "indirect" auto loans, which are made through dealerships, totaled 2.86 percent in the third quarter, a 16-year high. Credit-card delinquencies fell to 4.18 percent from 4.39 percent in the second quarter.”
From Dow Jones: “Consumer bankruptcy filings climbed 40% in 2007, as the ongoing turmoil in the housing market and growing debt levels held by consumers led more individuals to seek protection from creditors. The American Bankruptcy Institute, using data from the National Bankruptcy Research Center, said that total consumer filings were 801,840 for 2007… The large annual increase came despite a decline in consumers filing for bankruptcy protection between December and November. There were 66,389 consumer filings in the last month of the year, compared to 71,799 filings in November.”
More Companies Expecting a Recession
From The Financial Times: “America has entered 2008 in greater danger of recession than at any stage since the collapse of the internet bubble in 2000-01, as the world’s largest economy struggles to maintain growth in the face of the credit squeeze, a housing slide and high oil prices. Fourth-quarter growth for 2007 looks likely to come in at 1 per cent or less on an annual basis, while the current three months are unlikely to be much better and could even be worse… According to the latest NBC News/Wall Street Journal poll, more than two-thirds of Americans believe the US is either in recession now or will be in 2008. Some of the country’s most famous economists – including Alan Greenspan, the former Federal Reserve chairman, as well as Lawrence Summers, former Treasury secretary, and Martin Feldstein, president of the National Bureau of Economic Research – put the odds of recession at close to 50-50. This is striking, because economists say it is almost impossible to forecast recessions and, in the last quarter of a century, there have been only two brief and shallow periods of negative US growth...Bill Gross, chief executive of Pimco, the world’s largest bond fund manager, goes as far as to say he – like many ordinary Americans – thinks a recession has already started, in December. Ominously, the credit markets have started to price for recession, with risk spreads rising on securities that have no direct connection with the troubled housing or financial sectors…In addition, while credit markets appear to be pricing in an increasingly high likelihood of recession, equity markets and the oil market – while off their highs – are not. Wall Street is divided: Morgan Stanley is forecasting a recession, joining Merrill Lynch and Goldman Sachs, which are long-time bears, but JPMorgan and Lehman Brothers are noticeably less gloomy. Business leaders are split, too, with finance and housing executives much more pessimistic than their counterparts in other sectors… At the heart of the problems is the bursting of the housing bubble that helped to power American growth since this economic cycle started six years ago. The end of the bubble has brought a brutal slide in home construction, house price falls that threaten to undermine household wealth and consumer spending, and turmoil in the credit markets that are used to finance housing. The US has endured financial crises before with little or no effect on the real economy – for example, in 1987 and 1998. But these were autonomous financial crises with little connection to the underlying US economy. This financial crisis is different. It is defined by the bursting of twin bubbles in housing and the credit markets – bubbles that were deeply interconnected. Easy money and the collapse of discipline in the credit markets helped push house prices to unsustainable levels. But when the residential property bubble finally burst it took the credit market bubble with it – decimating the value of hundreds of billions of dollars of securities linked to subprime loans that were safe only as long as house prices kept going up. Now the credit crisis poses a direct threat of its own to the US economy. The secondary market for mortgage securities is dysfunctional, throttling the supply of many types of home finance and thereby putting further downward pressure on the housing market. Meanwhile, banks are being forced to take tens of billions of dollars in housing-related assets, once held in off-balance sheet vehicles, on to their books, while incurring massive writedowns on these and other securities.”
From The New York Times: “…while investors usually cheer an impending rate cut, the minutes only fueled anxiety that the economy would fall into a recession in the coming months.”
From Deutsche Bank: “I do not remember trading a mkt before that was so convinced of a recession even though there is virtually no evidence to support the idea. Undoubtedly, the economy is slowing, led by a moderation in consumer spending. Still, slowing is one thing, a recession is a whole different ball game. The only way Fed Funds go to the 2.5% rate that 2's currently imply is if the economy contracts. As rich as 2's are, 10yr notes are probably worse. The growth and inflation expectations implied by 10's are just plain silly. Yet, the mkt trades very well. Clearly, the set-up trade on the street the last few days of '07 was to get short. Now that 2's are 50bps richer than their auction stop, I'd imagine a lot of the shorts have been cleared out before tomorrow's number. Our economists think that a few more modest Fed eases could lead to a rebound. The street almost always underestimates the resiliency of the US economy. Does it really sound so IMPOSSIBLE that we rebound out of the housing slump? 2.8% 2yrs suggests the mkt thinks so.”
Dealer Outlooks for Economy
From JP Morgan: “For more than a year, a consistent rain cloud has hovered on the horizon as a downturn in housing, financial market stress, and rising energy prices has threatened to derail the US economic expansion. In the event, the economy chugged along solidly through 2007 even as it absorbed these significant drags. GDP growth is tracking 2.8% for the year as a whole (Q4/Q4). Payrolls have averaged a respectable 108,000 monthly gain through the first eleven months of the year and were accompanied by personal income growth of close to 6% …Our inclination is to raise 4Q07 GDP growth (currently 1.5%), while lowering growth for 1H08 (currently 1.75%). Stubbornly high energy prices and a view that some of the strength in 4Q07 demand — notably defense spending and early holiday shopping sales — is set to borrow from growth at the start of this year, warrant this revision.”
From Morgan Stanley: “The benign environment over the past few years of strong synchronous global growth, low inflation, low interest rates, and ample access to liquidity seems to be a relic of the past. The future is clouded with little consensus about how the turn in the credit cycle will play out… 2008 opens with volatility near multi-year highs across financial markets. This backdrop of instability is likely to persist, especially as expectations on central bank policy are far more diverse than this time last year…In our view, this suggests more, not less, volatility across markets going forward… After the strongest four year run in global growth seen in decades, the engine looks set to slow. While the global economy proved resilient to the initial deceleration in the US economy, our economics team looks for housing-related weakness to drag more meaningfully on the consumer. This should result in more spillover to the global economy given the broader reach of the US consumer relative to the insulated US housing market. Indeed, slower growth is already evident in Canada, the UK and, increasingly the Eurozone. China too may slow in the second half of 2008 if policymakers’ attempts at cooling the economy take hold, particularly as Olympics-related spending tapers off. The relatively slower pace of global growth in 2008 would suggest greater downside risks for commodities, weighing on currencies with greater leverage to the global growth cycle… Though it is not clear the worst is yet over for the USD, there is already a lot of bad news in the price… We kick off 2008 …stuck in risk aversion mode. With market sentiment on tenterhooks and the healing process likely to drag on, the safe haven bid should remain alive.”
From Goldman Sachs: “ISM shift to contractionary territory hurts equities, rallies bonds. Oil close to $100/bbl adds to market jitters. Market has priced significant US weakness in rates, consumer stocks. But history suggests recessions see even more easing than now priced. Current expected easing cycle would be unusual as an actual outcome… …since market is pricing more than a mid-cycle episode, less than recession. We see more growth risk than the market still.”
Benefiting From the Return of Stagflation
From Barclays: “The first trading day of 2008 was marked by a blunt reaffirmation of the stagflation theme. Gold, platinum, gasoline, the CRB and crude oil all moved up sharply to new historical highs. Meanwhile, manufacturing data in the UK and the US were weak and below expectations, with Q4 Singaporean GDP surprising by a 3.2% contraction. Although Libor rates have fallen slightly, there is little evidence from either the credit or money markets that the credit crunch is easing in the new year. Indeed, the BoE bank lending survey – the latest of such surveys to be published, conducted between 19 November and 12 December – showed a pronounced tightening in credit terms and availability to both households and companies. Expectations for a quick improvement in the lending markets are wide of the mark. The core problem has been a very rapid growth in bank assets…The annual increase through to November is almost double the average increase of the prior couple of years. Since the annual increase in deposits for US and eurozone banks during 2007 was in line with past experience, the shortage of term funding or liquidity is readily explained. Although the consensus has it that the lack of term liquidity in the money markets is due to mutual fear within the banking system, the truer explanation is simple indigestion, due to involuntary bank asset growth. The process of securing the appropriate funding – presumably via “sticky” retail deposits – for these assets is likely to take some time. It is implausible to believe that the advent of a fresh year will suddenly provoke an outbreak of normality in the money markets. Overall, the economic background of a sharp credit tightening, slowing growth and rising inflation pressures remains very much extant as we enter 2008… we should expect to see Asian and Western economy growth rates diverge. The economic implications of this situation are wholly and perhaps counter-intuitively negative. The continuation of strong Asian and developing economy growth is one of the factors pushing natural resource prices higher. In turn, the effect of higher commodity prices on US and European inflation rates is to curtail central banks’ freedom of manoeuvre, limiting the degree to which they can offset the credit crunch with lower rates… Stagflation is not a positive environment for equities. As we have pointed out in the past, history shows that equities deliver their worst returns (an average annual total return of minus 1.9% in real terms or 4% in nominal terms since 1929) during economic interludes characterised by above-trend inflation and below-trend growth. Fairly obviously, the underlying cause of this weak performance is likely to be a latent fear that high inflation will inhibit monetary authorities from fully offsetting the contraction with lower interest rates, compounding the more typical concern that slower growth will bring lower profits… In the current instance, the stagflationary condition could prove more persistent than usual. For the sake of example, although US growth has decelerated very sharply, there is no evidence of a comparable deceleration in commodity demand. Indeed, even within the US, gasoline demand in December is set to record the 26th straight month of year-on-year increases, according to our commodity colleagues. Meanwhile, non-OECD oil demand growth remains robust, with non-OPEC supply continuing to surprise the market to the downside. At the risk of gross over-generalisation, the primary causes of the supply/demand imbalance in the physical resource markets are twofold. First, there has been a very significant increase in the level of demand driven by rising per capita demand in the large developing economies. Second, a combination of diminishing easily accessible supplies, a rampant inflation of sectoral labour and capital goods costs and the various influences of global warming have all conspired to dampen supply growth across a wide range of raw materials. Both of these factors are more secular than cyclical in nature and are not likely to be repealed by slower growth. A further consideration regarding the persistence of stagflation is the desychronisation of regional growth patterns, with growth in the emerging economies – who have been responsible for the bulk of the resource demand increase – remaining firm for the time being. If equity exposure should be eschewed in a stagflationary phase, the historical record is more confusing for bonds. For an entire 77-year sample of US asset returns, we have found that bond (20-year average maturity) returns are typically very weak, averaging just 1% in nominal terms during stagflationary periods. However, if we confine the sample to the past 20 years, we find that average nominal bond returns are a more respectable 6.4%. Although the latter sample is of necessity very small, these findings would seem to suggest that the bond market’s response pattern to stagflation may have undergone a shift during the 1980s. This shift was perhaps engendered by increased confidence that intervals of high inflation would always prove transitory, inflation eventually responding to slower growth under the standard output gap analytical framework… Overall, we continue to feel that the current stagflationary environment justifies the negative view we have taken on equities and the cautiously bullish views we have taken in bonds of both the real and nominal varieties, along with commodities.”
Asset-Backed Commercial Paper Market Shows Signs of Improving in New Year
From Bank of America: “Asset-backed commercial paper outstanding rose last week for the first time since mid-August.”
From Citi: “Yesterday saw a sharp move down in the asset-backed CP spread (167bp from 283bp) which suggests that a significant part of the recent rise was related to year-end funding concerns and was not of a more structural nature.”
From Barclays: “Yields on 30-day ABCP have fallen close to 40bp over the week and the spread over fed funds has come down considerably (to 50bp) after widening close to 200bp in mid-December. The asset-backed CP market had been deteriorating on continued tensions in money markets spurred by concerns abut year-end funding and mortgage-related collateral, which backs a notable portion of ABCP. Today's data hints at some improvement in this area of the market now that year-end funding pressures have faded, but we would have to see the improvement be sustained in coming weeks to draw any firm conclusions.”
Another Bull Year for Commodities?
From Citi: “What happened in commodities yesterday has happened before. In both 2004 and 2005, the GSCI rose sharply at the very start of the new year…In 2004, it rose 3.7% on the second trade date of the year and in 2005 it rose 1.5% on the second trade date of the year. In both cases it turned out to be an absolutely phenomenal year for commodities as the GSCI index was up over 42% to the high in 2004 and over 56% to the high in 2005. Both years saw peaks in late summer and, here is the important part, both rallies were due to massive asset in-flows into commodity space. We rose over 3% yesterday and my opinion is that we are again seeing massive asset flows into commodity space. Implications if I'm right: 1) Hard not to be a rip snorting bull in commodities as a little bit of money can go a long way in that space 2) We would see $4 gasoline at the pump and that would not be good for the U.S. economy. 3) Can $1000 gold and a 3 handle on 10's co-exist? I don't think so, for long. 4) Not necessarily bearish for dollar or stocks. 2004 saw dollar rise and energy and materials are 15% of S&P compared to 18% for financials.”
From Merrill Lynch: “…the Baltic Dry Index (measures global shipping rates) has slid sharply and at 8,891 today it is almost 20% below the mid-November peak and down to a four-month low.”
From Barclays: “…we wanted to highlight the strength of the ongoing upside trend in gold. The yellow metal is rallying against the major currencies and has been outperforming the Dow Jones Industrial Average since 2000. We are looking for the market to test 1000 in 2008. Over the last few years, gold has rallied 32% and 24%, respectively. The average annual gain over the past seven years has been approximately +16%. Since the market is currently approximately 16% below 1000, our 2008 target actually implies an average year of gains for Gold.”
Questioning Value of Credit Rating Agencies
From The Street.com: “Here's a New Year's resolution for Wall Street: Stop letting credit ratings agencies get paid by debt issuers for grades that can make or break their products. In the mortgage debacle that plunged U.S. financial markets into crisis last year, there's no shortage of culprits. Snake oil-selling lenders, naive borrowers, delusional investment bankers and snoozing regulators all fit the bill, but the major credit rating agencies stand out as the chief enablers. Blessed by government regulators with their unique and exclusive authority, the ratings firms institutionalized the notion that securities backed by subprime loans were basically risk-free. In other words, rather than fulfilling their proper role in the market by warning investors about the obvious risks involved in these securities, they instead opened the floodgates to all those bad actors and created a systemic problem. Why did the credit rating agencies fail so spectacularly? There's one simple reason: They were paid handsomely for their stamp of approval by the very financiers who were packaging up the bad loans and selling them around the world. "It's as if movie studios hired film critics to review their movies, and paid them only if the reviews were positive enough to get lots of people to see a movie," former Labor Secretary Robert Reich wrote on his blog. "The whole thing rested on a conflict of interest analogous to that of stock analysts who, before the dotcom bubble burst, advised clients to buy stocks their own investment banks were issuing."
MISC
From Merrill Lynch: “…the ADP data has had this tendency to overestimate private payrolls over the past 3 and 6 months. This is because the ADP does not include many large financial institutions, which do their own payroll and this sector right now is at the epicenter of the job cuts (along with housing).”
From Bank of America: “Our outlook for 2008 for credit finds the solution to the subprime mortgage crisis in a classic recipe: inflate your way out of it. Either by accident or intention, global central bank liquidity infusion to forestall the slowing impact from the credit crunch likely results in increased inflation.”
From CITI: “The aggressive liquidity injections from central banks have been part of a strategy to expand their own balance sheets in order to facilitate an orderly contraction of private sector balance sheets. It is still relatively early in the adjustment process and the central banks are likely to have to continue providing liquidity for at least the next quarter while withdrawing it at a gradual pace. Looking ahead to the rest of 2008, it is possible that greater regulation of financial market participants could be one of the direct outcomes of the credit crunch.”
From Dow Jones: “Bond guru Bill Gross, the founder and chief investment officer of PIMCO, said he expects the U.S. Federal Reserve to keep cutting rates in 2008, “perhaps as low as 3% and maybe more depending on the housing situation.” The Fed’s current current fed funds rate target is 4.25%. Gross, in an interview with CNBC, said inflation concerns and the weak dollar are “third and fourth order” considerations for the Fed, and it will focus on a “substantially” slowing U.S. economy for monetary policy. Gross told CNBC that the U.S. credit contraction problems will continue as part of a two-to-three-year housing cycle.”
From The Associated Press: “In a sign of how the once mighty U.S. dollar has fallen, India's tourism minister said Thursday that U.S. dollars will no longer be accepted at the country's heritage tourist sites, like the famed Taj Mahal.”
From Bloomberg: “Foreign investors exploited the declining U.S. dollar during the past three months to snap up American companies, taking the biggest share of U.S. deals in at least a decade. Buyers from Dubai to the Netherlands accounted for 46 percent of the $230.5 billion of U.S. mergers and acquisitions announced in the fourth quarter, the largest portion since 1998 when Bloomberg started compiling the data. The total excludes $17.9 billion of so-called passive investments by state-run funds in Asia and the Middle East in U.S. banks, including New York-based Citigroup Inc. The influx of overseas buyers cushioned a drop in domestic deals, as tighter credit markets ended the leveraged buyout boom that spurred record-setting takeovers in the first half 2007. Foreign acquirers, who stepped in as the dollar fell 10 percent against the euro last year, show no sign of losing interest, according to bankers and lawyers.”
From Dow Jones: “The yen is on a tear versus its currency rivals in the first days of 2008… It hit a five-week high against the dollar this week…[But] The simple argument against the yen this year is the same one that was used last year, the year before that and the one before that: interest rate differentials. The Bank of Japan’s key interest rate stands at a tiny 0.50%, while the central banks in the U.S., the U.K. and the euro zone have lending rates that range between 4% and 5.5%. Investors who buy the yen and sit on it are earning significantly less interest than they would with currencies from those other regions. With such small returns offered on the yen, Reid believes that investors will continue to use Japan’s currency as a funding currency for the carry trade, in which they take out loans denominated in yen to buy higher-yielding currencies.”
From Merrill Lynch: “We have motor vehicle sales tracking near 16.2 mln units, above street expectations of 16.0 mln units.”
From SunTrust: “Since Christmas, the 2 yr note has fallen 51 bp. The 2/10 spread is +107 bp, the widest in 3 years. The Treasury market is heading into the December payroll report very near recent highs and almost exactly at identical levels just prior to the last jobs number.”
End-of-Day Market Update
From RBSGC: “The main 'play' on Thursday was the steeper curve with 2s improving on the day while the balance of the curve merely tread water.”
Three month T-Bill yield fell 2 bp to 3.23%.
Two year T-Note yield fell 6.5 bp to 2.81% ( A new 3yr low)
Ten year T-Note yield fell 1 bp to 3.90% (3y low is 3.84%)
Dow rose 13 to 13,057
S&P 500 unch at 1447
Dollar index fell .1 to 75.87
Yen at 109.3 yen per dollar
Euro at 1.475 dollars per euro
Gold rose $5.6 to $863 – A new record high of $869 traded today!
Oil fell .49 to $99.13 – A new record high of $100.09 traded today!
*All prices as of 4:20pm
Two Year Yield Treasury
Gold
Wednesday, January 2, 2008
Today's Tidbits
From Goldman: “…the FOMC gave much stronger evidence in this set of minutes that it was more concerned about unacceptably weak growth than about unacceptably high inflation.”
From Bloomberg: “Crude oil reached a record $100 a barrel and gold soared to the highest ever, leading a commodity surge as the dollar's slump against major currencies enhanced the appeal of raw materials as hedges against inflation. Spot gold climbed to $860.10 an ounce, and wheat and soybeans jumped more than 3 percent.”
From Dow Jones: “President George W. Bush is to receive an update Friday from his Working Group on Financial Markets. White House spokeswoman Dana Perino wouldn’t go into specifics of the session, saying only that it will be a broad update on the economy. The working group is chaired by Treasury Secretary Henry Paulson and includes Federal Reserve Chairman Ben Bernanke, Securities and Exchange Commission Chairman Christopher Cox, and acting Commodity Futures Trading Commission head Walter Lukken…Facing fears that the economy could slip into recession this year, the White House is pushing lawmakers to take steps to shield the housing sector from further erosion. White House aide Ed Gillespie told reporters Tuesday on Air Force One that the administration wants Congress to “help make the market more stable.”” [Editor’s note – This group is sometimes referred to as “The Plunge Protection Team”.]
From Lehman: “Equity markets weakened over the holiday period. The S&P 500 index declined 1.1% between December 21st and 31st, and ended the year up 3.5%.” [Editor note – if dividends are included, the S&P 500 total return was 5.5% for 2007.]
From Merrill Lynch: “…the Russell 2000 posted its first loss since 2002 at -1.57%. Financial Services was the killer for the year, as the sector declined 15.66%…Energy was one of the leaders for the year at 16.15%.” [Editor note - Russell 2000 is one of the broadest equity market indicators, including all major large and small cap stocks. On price basis only, the return performance was -2.75% for 2007.]
From Merrill Lynch: “All else equal, today's construction spending numbers take our 4Q GDP to +1.7% from +1.3% QoQ annualized. We continue to track a material slowing in GDP in 1Q 2008, to 0.3%, driven by a pullback in consumer spending.”
From Goldman Sachs: “ISM index drops well below 50 in first sign of nationwide setback in industrial activity. Moves of this magnitude are usually not flukes (a drop of 3.1 points).”
From Morgan Stanley: “Latest swing in ISM series is consistent with recession.”
From Lehman: “While the [ISM manufacturing] reading does suggest a slower pace of growth in the economy, consistent with sub-2% GDP growth, it does not indicate negative growth/recession. The breakeven level of the ISM for recession in the overall economy is 41.9, well below the current level [47.7]… Also of some interest is the sharp decline in export orders”
From Merrill Lynch: “What is truly underappreciated is the extent to which the weak dollar has supercharged domestic export competitiveness, and because of the long lags, these benefits, especially for basic manufacturing, are going to linger for at least another three years…US manufacturing unit labor costs are now 30% lower than the average in the rest of the industrialized world…at no time in the last three decades has US manufacturing competitiveness relative to the rest of the world been as solidly positioned as it is today. And, to show you how important a role the currency plays, over 90% of the relative decline in our unit labor costs since 2002 has been due to the lower dollar.”
From Dow Jones: “Debt issuance worldwide fell for the first time last year since 2000 as worries over the state of the global credit market in the second half weighed heavily on sentiment, data provider Thomson Financial said. New debt issues declined 7% to US$6.6 trillion, with issuance falling 47% to US$2.3 trillion in the second half from the record-breaking US$4.3 trillion of new issues seen in the first half, Thomson said.
Issuance eased in the second half as the high spreads caused by the U.S. subprime mortgage crisis discouraged investors and lenders alike. High-yield corporate bond issuance fell 10.3% to US$165.6 billion for the whole of last year despite showing the biggest semiannual total on record during the first half, while high-grade corporate bond issuance decreased 3% to US$2.56 trillion, Thomson said.”
From Lehman: “The TAF auctions show a surprising amount of demand from smaller banks.”
From JP Morgan: “… release of the Fed's weekly consolidated balance sheet, the first since the settlement of the first Term Auction Facility (TAF), confirmed that most of the liquidity provided through the TAF was offset by a reduction in liquidity supplied through other, more conventional channels. The total amount of reserves supplied by the Fed increased by just $2.59 billion in the week ending yesterday, even though reserves supplied through the TAF increased by $20 billion. The difference is accounted for by the fact that reserves supplied through Fed holdings of securities, both outright holdings and those held under repo, decreased dramatically. Any asset purchased or borrowed by the Fed creates reserves -- liquidity -- and, as such, the TAF did not materially alter the amount of reserves in the financial system, but rather changed the composition of the Fed's assets as well as the composition of assets held by the Fed's counterparties. Its hard to say what to make of the geographical breakdown of the TAF awards, but for completeness, banks in the NY district were awarded the lion's share, ($16.49 billion), followed by Dallas ($1.4 billion), St Louis ($1 billion), San Fran. ($610 million) Chicago ($475 million) and Richmond ($25 million). Also of note, discount window borrowing remained elevated last week: average borrowing for the week ending yesterday inched up $216 million to $4.802 billion.”
From Morgan Stanley: “Buffett starting a new monoline focused on munis per WSJ. I view this as negative for the existing monolines. Amount of business in muni world is finite and BRK has a meaningful advantage vs peers - a rock-solid AAA.”
From Dow Jones: “Retailers’ credit default swaps, a gauge of investor confidence, widened by 5 to 10 basis points on concern that economic weakness is affecting consumer spending…”
From Bank of Montreal: “The Florida Association of Realtors and the California Association of Realtors released some local data on home prices and sales for November and the data were not positive. In Florida, median home prices were down a steep 10% y/y in November (or 5% YTD), with the deepest cuts coming from Punta Gorda (-18% y/y), Fort Pierce (-17% y/y), and Tampa (-15% y/y), while Miami has been the hardest hit in terms of sales at -59% y/y. In California, single-family home prices fell 11.9% y/y in November, while condo prices have only dropped 5.2% y/y. Sales in the state are down over 30% from a year-ago, while sales in Ventura and the northern portion of Santa Barbara have plunged over 50% y/y.”
From CITI: “The threat of downgrades continues to hang over the monoline insurers who collectively insure about $3.3tr dollars of debt.”
From Chart of the Day: “The stock market has had a tendency of being somewhat choppy during the first five months of an election year, but prospects tended to improve (on average) as the November election approached.” [Editor’s note - Stock prices tend to rally in election years]
The Street.com: “Analysts expect the banking sector to post a 43% year-over-year drop in fourth-quarter net income, according to Thomson Financial. Regional banks are expected to post a 50% drop in net income, Thomson says. The growth rates compare estimated net income, which excludes one-time items, in the fourth quarter to actual net income (excluding one-time items) in the fourth quarter of 2006.”
From The Financial Times: “Middle Eastern and east Asian sovereign wealth funds have made a succession of investments in four US banks…Most commentators have been inclined to welcome this global bail-out: better to bring in foreign capital than to shrink balance sheets by reducing lending. Yet we need to recognize that these “capital injections” represent a transfer of revenues from the US financial services industry into the hand of foreign governments…In other words..the balance of financial power is shifting…It remains to be seen how quickly today’s financial shift will be followed by a …geopolitical shift in favour of the new export and energy empires of the east. Suffice to say that the historical analogy does not bode well for America’s quasi-imperial network of bases and allies across the Middle East and Asia. Debtor empires sooner or later have to do more than just sell shares to satisfy their creditors.”
End-of-Day Market Update
From Dow Jones: “Treasurys prices took flight again Wednesday…The dollar fell to a five-week low against the yen…After months of anticipation, oil futures reached $100 a barrel Wednesday…The new year started with a jolt for investors as the prospect of $100 oil, inflation and a manufacturing slowdown helped kick off 2008 with a stock-market plunge.”
From Lehman: “It’s been a one way ticket in rates today, with convexity receiving kicking in and bringing spreads in off their wides,a nd sending us home at the lows in rates.”
Three month T-Bill yield fell 7.25 bp to 3.25%. (6m range 2.86% to 5.01%)
Two year T-Note yield fell 17 bp to 2.88% (Only 3bp higher than 2.85% 3yr low)
Ten year T-Note yield fell 11.5 bp to 3.91% (3y low is 3.84%)
Dow fell 221 to 13,044 (-1.7%)
S&P 500 fell 21 to 1447 (-1.4%)
Dollar index fell .68 to 75.97
Yen at 109.6 yen per dollar
Euro at 1.473 dollars per euro
Gold rose $23 to $857 – A new record high of $860 traded today!
Oil rose $3.40 to $99.37 – A new record high of $100 traded today!
*All prices as of 4:25pm

National Manufacturing ISM Unexpectedly Contracted in December
The U.S. ISM manufacturing index fell to 47.7 in December, from 50.8in November. Consensus had looked for only a slight weakening to50.5. Any reading below 50 indicates contraction. This is the lowestlevel for the index since the spring of 2003, when it bottomed out at46.4. This decline indicates that the dollar's decline has not beenable to increase exports enough to offset the internal weakness in theU.S. economy, as the housing recession spreads. Slowing factoryproduction reduces economic growth. This was the first decline inmanufacturing growth in ten months.
Areas seeing the most weakness include production (47.3), new orders(45.7), and order backlogs (43). Customer inventories rose to 51.5,and prices paid rose to 68. Higher material prices continue to erodeprofit margins. Manufacturing inventories have now contracted for 17straight months. Employment remained below 50, at 48, for the thirdmonth in a row.
Housing related industries appear to be the hardest hit, while exportindustries continue to thrive. The decline appears to be related moreto slowing demand than excess inventories. Credit rationing remainsan issue for demand. The industries showing growth in December wereapparel, energy, food, electronics, machinery and metals.
Small Improvement in Construction Spending in November
Construction spending unexpectedly rose +.1% MoM in November(consensus -.4%). In addition, the prior month was revised to only a-.4% MoM decline from the originally reported -.8% drop. Once again,all of the weakness was in residential spending which fell -2.4% MoM(-17.5% YoY), while non-residential spending rose +2.1% MoM (+18.1%YoY). Over the past year, construction spending has fallen -.1% YoY.
Private spending fell -.7% MoM (-4.8% YoY), while public spending rose+2.5% MoM (+16.2% YoY), the most in almost a year. Growth last monthwas focused on schools, power plants, and factories, as new homeconstruction fell to a five year low.
Public spending over the past year has been evenly distributed betweenresidential (+13% YoY) and non-residential (+16.3% YoY). In November,Federal spending grew 2.2% MoM while state and local spending rose2.2% MoM. But, over the past year, Federal spending (+1.7% YoY) haslagged substantially behind state and local spending (+17.4% YoY).
Construction growth is expected to remain under pressure, as thehomebuilding market remains weak, and tighter credit conditions slowdemand in other sectors as well
Subscribe to:
Posts (Atom)